HomeTurbodata Business IntelligenceTurbodata predictive analyticsTally Data ConsolidationNavision Business IntelligenceData Capture ServicesData CleaningData Normalization-Data CompressionDashboard and Report Design-Data MiningManagement TeamContact UsCase Studies-Turbodata

Godaam-ERP Integrated Inventory Analytics Module


 history_spec2.jpg        jit-dashboard.jpg       easydataaccess.jpg


safetystock.jpg     

User Friendly Inventory Analytics Module for Tally. ERP 9

Our system provides the following benefits to the client:


  • Almost Real Time Reports: Our system provides Dashboards and reports updated on almost real time basis from Tally.ERP 9
  •  Integration: You can integrate Tally.ERP 9 data with other ERPs on a near real time basis.
  •  Capture History of Last few years transaction Data: you can get reports involving past data which may have been removed from the Tally.ERP 9 system for freeing system capacity.
  •  Consolidation: You can get real time Dashboards by consolidating data from both Tally.ERP 9 and other ERP systems.
  •  Highly scalable system: Any customer with  large network of Distributors/Stockists PAN India can easily consolidate data of all of them on a near real time basis at a centralized place.
  •  Flexible: Design  your own  Dashboards and Reports, moreover the same can be customized based on  users needs.
  • Inventory valuation: We can help in designing a comprehensive assessment of inventory valuation using FIFO/LIFO/Weighted average methods.


 history_dashboard.jpg


 Why us?

Our process of normalization ensures the following for the end client:

  • Capture of history
  • Capture of inserts, updates and deletes
  • Real time analysis
  • Design of highly scalable system 


 Our standardized datawarehouse structure enables us to achieve the following:

  •  Integrate various data sources.
  • Make reporting solutions over various platforms.
  • Incorporate changes in the client source systems very quickly.
How do we do the process?
Please watch the videos.
 

What are the sample  dashboards and reports do we offer?
Some of the sample dashboards and reports are given below:
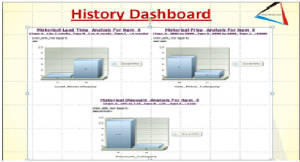
  • Yearly trends
  • Seasonality trends: over 3 to 5 years
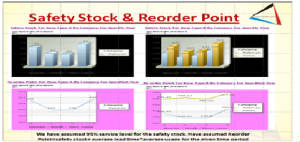
  • Overstock and Understock analysis
  • Supplier Analytics
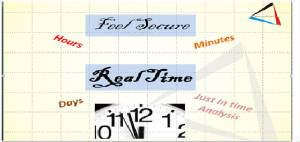
  • Just In Time Inventory Analytics 
 We can analyze the inventory using the following methods:
1.) Stock Categories
2.) Stock groups
3.) Vendors(if the data for the same is available)
4.) Analysis of stocks at item level by the following parameters:
a.) Batch-wise
b.) Reorder level, reorder quantity
c.) Minimum order quantity

5.) Order-wise attributes: batches, lot-wise.
6.) Source of purchase/procurement


Inventory sales and usage could be analyzed within the following parameters:
1.) Warehouse

2.) Multiple godowns

For a comprehensive presentation, please check the link below:
 

Tallyinventoryppt

Tallyinventorypdf

For case studies involving various Business Intelligence tools please click here


Sales contacts

In case you are interested, you could contact the following:


Apoorv Chaturvedi: apoorv@mnnbi.com,apoorv@mndatasolutions.com. Phone: 08802466356